System observability
This page is intended to be a living document of the different ways you should think about instrumenting your system to be able to operate it effectively and gather data to inform future features.
Checklist
Ideally you should be able to answer any of the following for your system within short notice.
- Is my system healthy?
- Has the behaviour of my system deviated recently?
- Do I need to plan maintenance or scaling work on my system?
- How was this request fullfilled by my systems?
- What are the important events that were performed by my system recently?
- What are the events that customers/security/legal need to know about?
- How did this customer use my system?
- What are the different customer personas using my system?
Glossary
- metric a stream of events sent from your systems. These are usually numeric e.g. latencies of calls against your service or boolean e.g. whether a worflow was successful. Metrics can be processed (e.g. counting number of successful wokflows in a minute) and/or combined (e.g. successes/total-workflows to get a success-ratio metric).
- signal an event that is triggered automatically. It is intended to communicate a change of state e.g. from healthy to unhealthy. Often this requires both a metric and a condition (e.g. a threshhold) that will trigger based on the metric.
- log individual events written to files. Logs can then be processed periodically to create metrics or they can be queried/processed sporadically during investigations.
- signal-to-noise ratio the ratio of useful/reliable events to the noisy/unreliable events. An alarm that only triggers when there's a real problem has a high signal-to-noise ratio. An alarm that triggers lots of false alarm has a low ratio. See also the wikipedia entry.
- canary service a.k.a. synthetic monitoring is a system which calls your system and pushes metric streams for its success rate. Used to provide early detection of failure.
Detecting and mitigating impact
Health signals
Is my system currently healthy?
These signals tell you if your system is unhealthy. These signals need to be able to convey a direct, binary state "my system is healthy" or "my system is degraded" answer. These signals are what should trigger alarms. They should be explicitly designed they should have a high signal/noise ratio. You should also be able to use these metrics to confirm recovery once the issue has been mitigated.
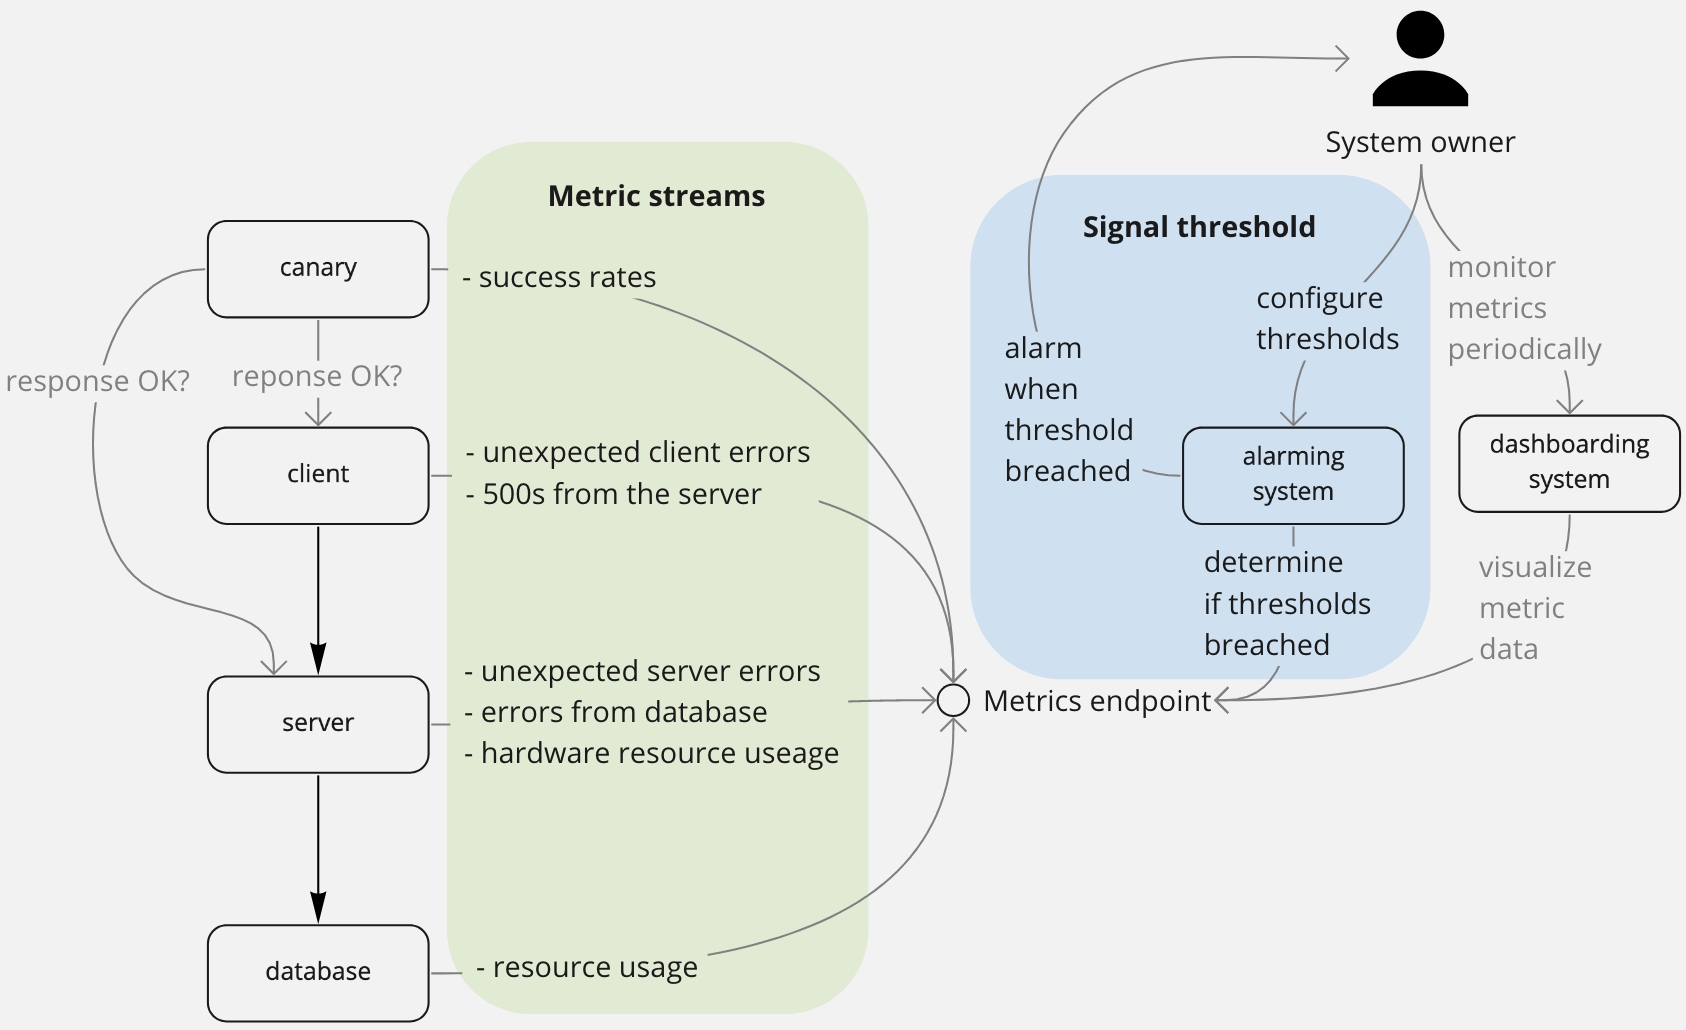
These metrics do not tell you what caused the issue and they don't tell you how to fix it. They just detect the presence of an issue.
Examples:
- Sustained canary failures
- Too many internal/uncaught errors
- Breaching performance SLAs
- Unexpected service restarts
- Limits reached for a resource
Diagnostic metrics
Has the behaviour of my system deviated recently?
These metrics surface a (usually recent) history your system's behaviour. They are used to help locate where errors are being thrown in your system, help diagnose the issue, and help confirm that actions made against the service are affecting behaviour as expected.
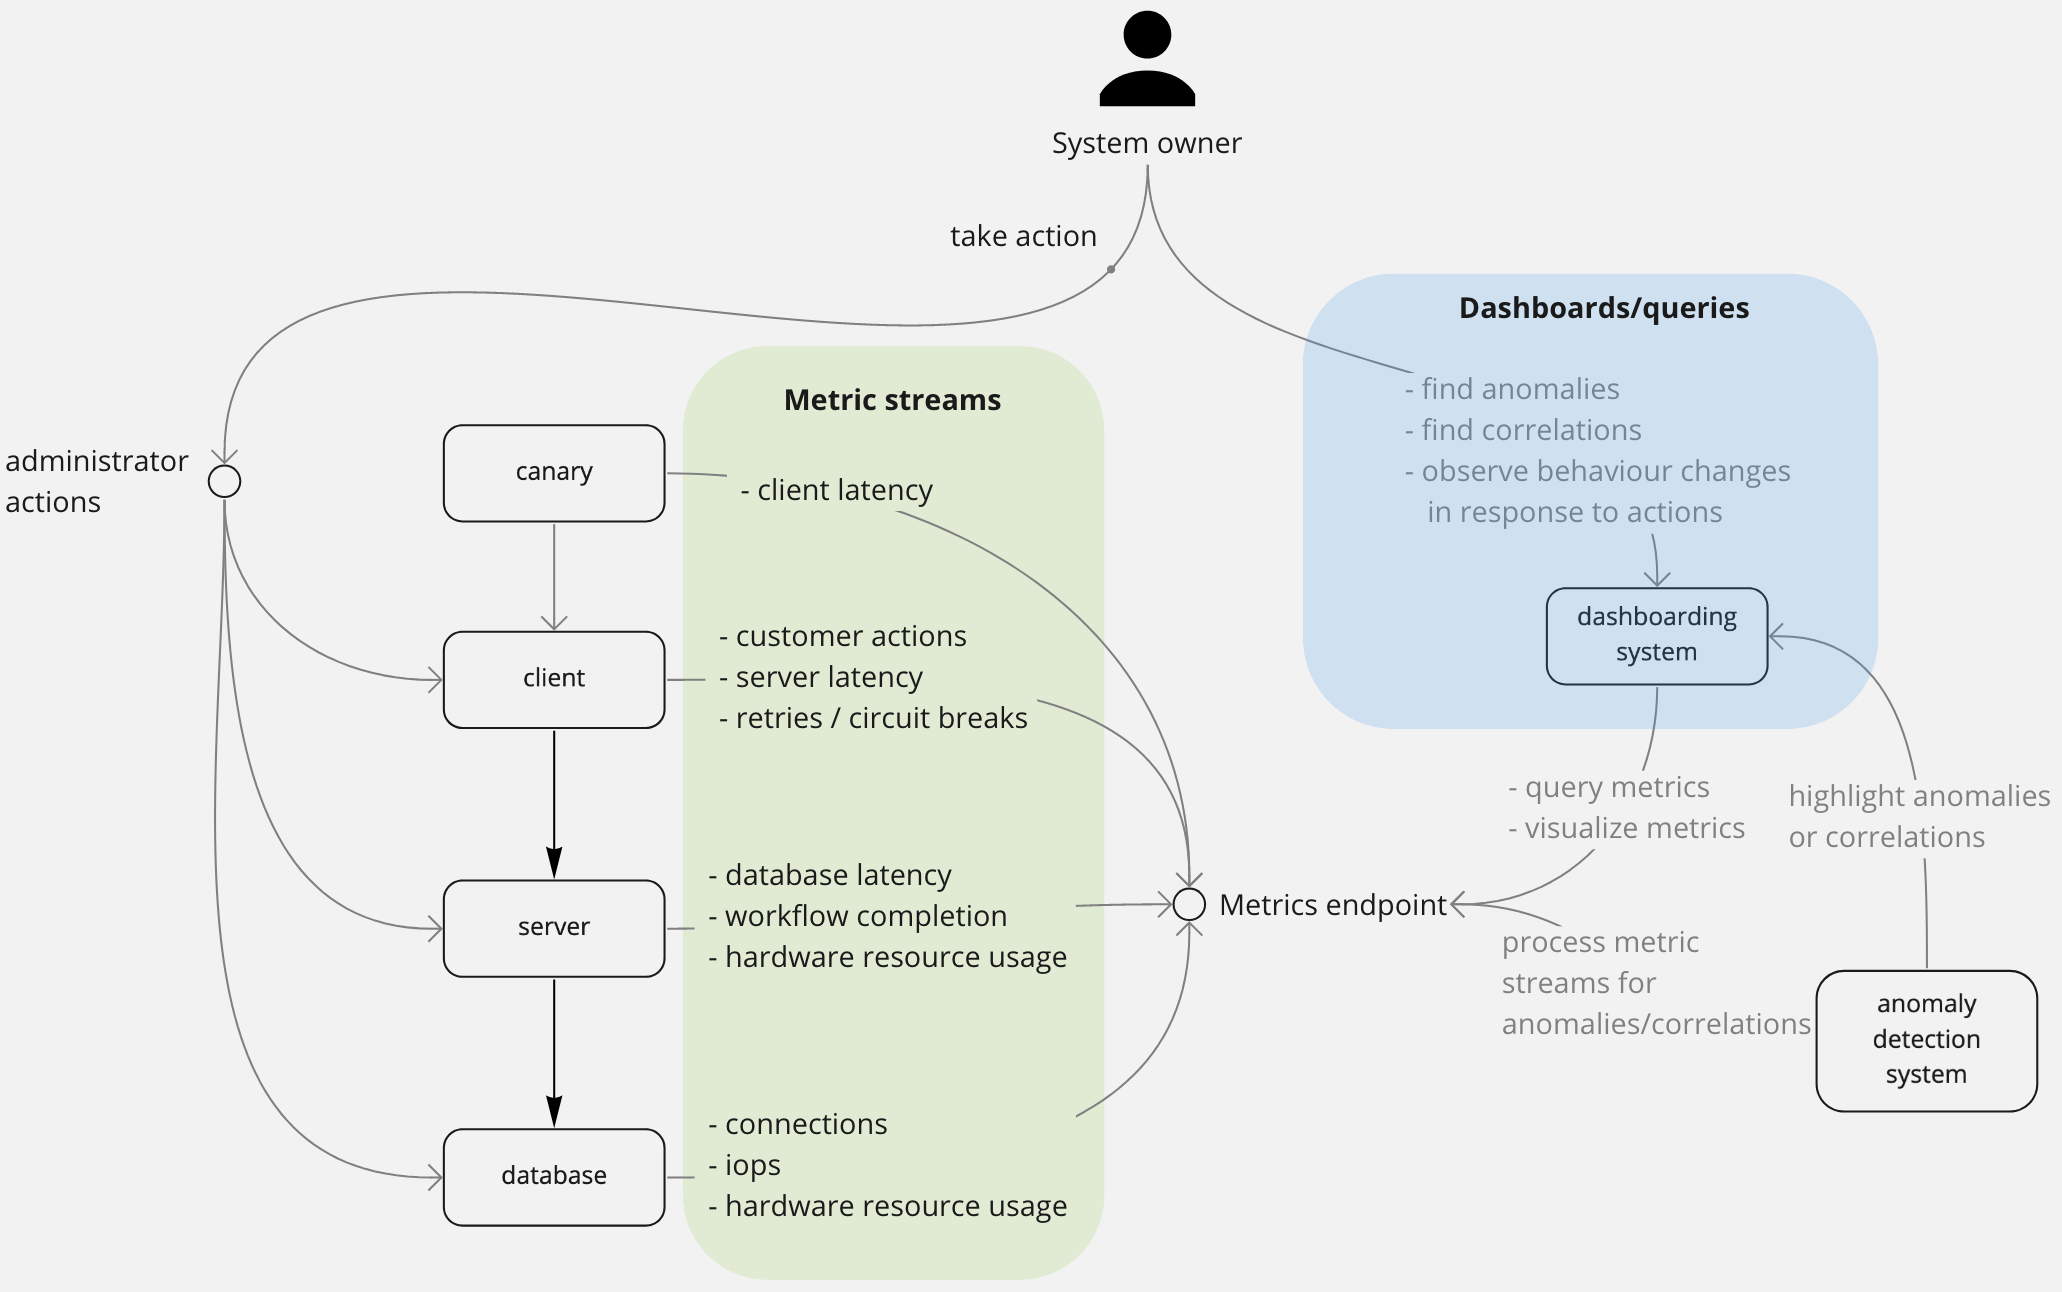
Examples:
- successful workflows of a subsystem
- latency of a network network call
- messages in a message-bus
- customer traffic against the service
- API requests dropped by the loadbalancer
- system resource usage has hit a hard limit
Scaling signals
Do I need to plan maintenance or scaling work on my system?
These signals try to pre-empt future incidents. They are often diagnostic metrics on which you can set up a threshhold because you've determined that they are strongly correlated with particular root causes. Because of this, they often have a lower signal/noise ratio. You want to hook up alerts to these, but usually of lower severity than health metrics. These alerts should trigger investigations rather than fire-fighting.
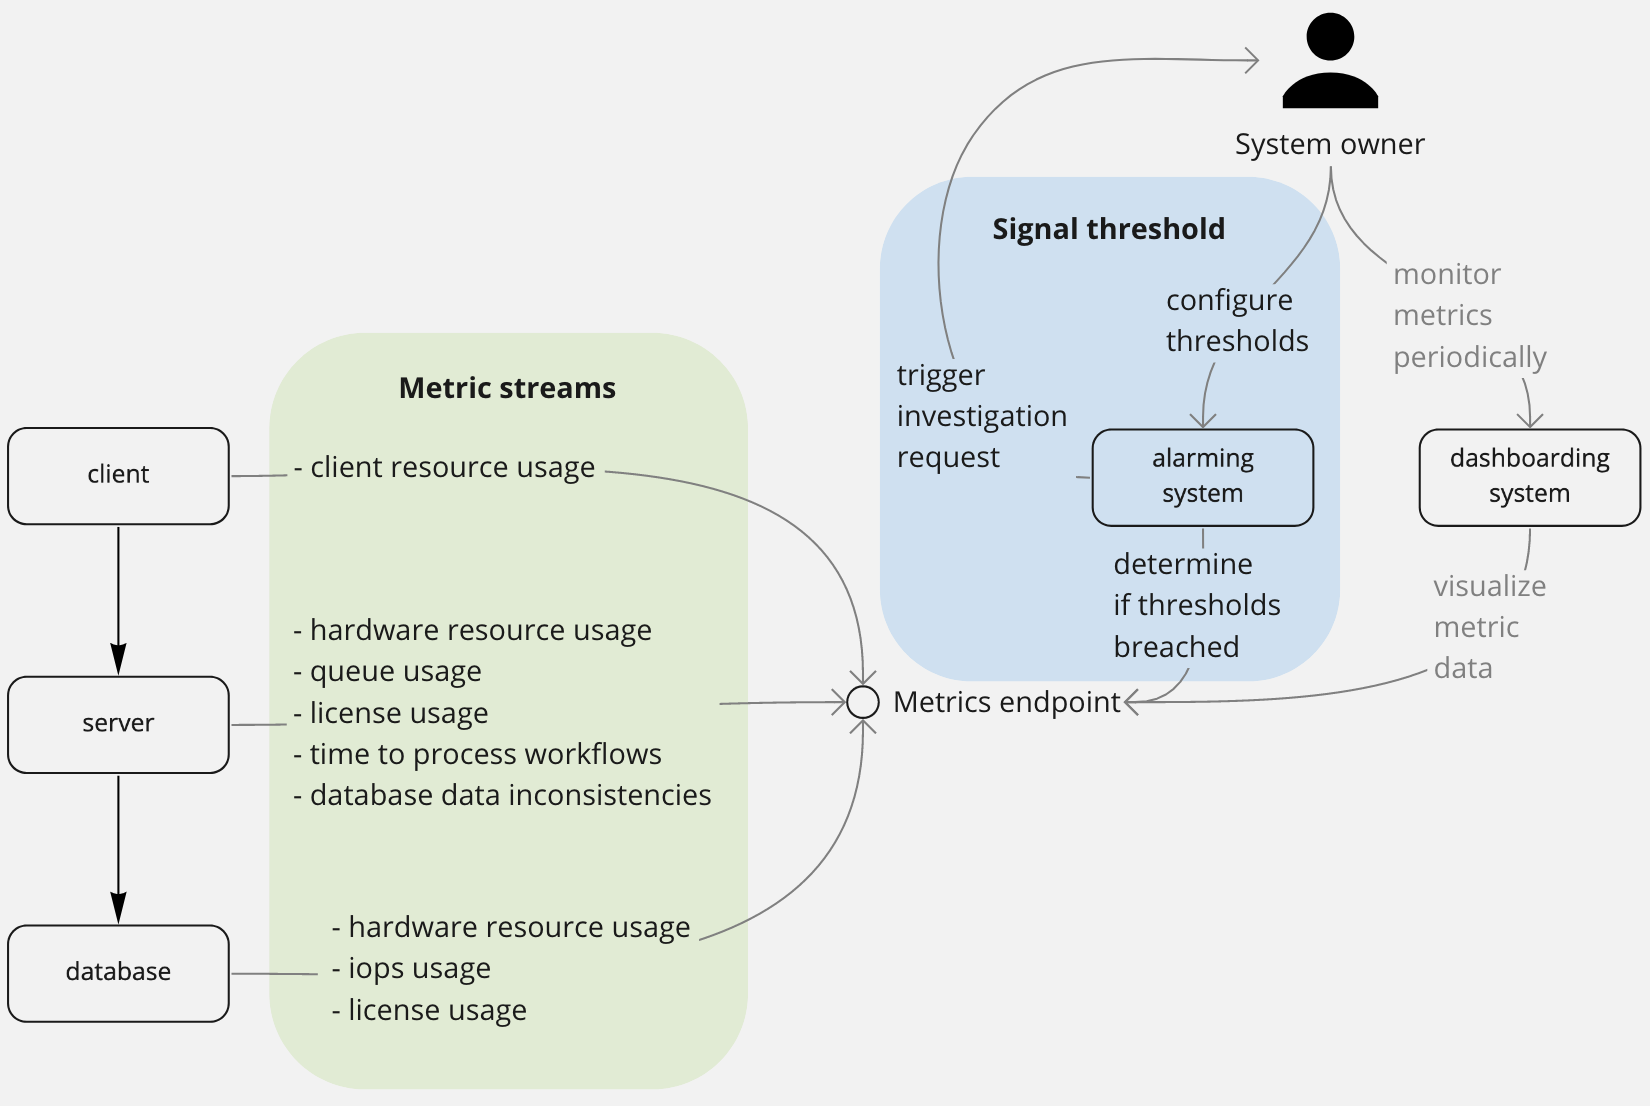
Examples:
- threshholds on resource usage like sustained 60% CPU usage or 80% disk usage
- threshholds on expected system load/throughput like expect a minimum of 500 active users per 30mins at any time during the day. Note that this is not the same as SLAs where you have an agreement to provide certain performance; these are to try to catch when a system behaviour is atypical.
- threshholds on difference in processing rate between a producer and consumer
Investigations
Distributed traces
How was this request fullfilled by my systems?
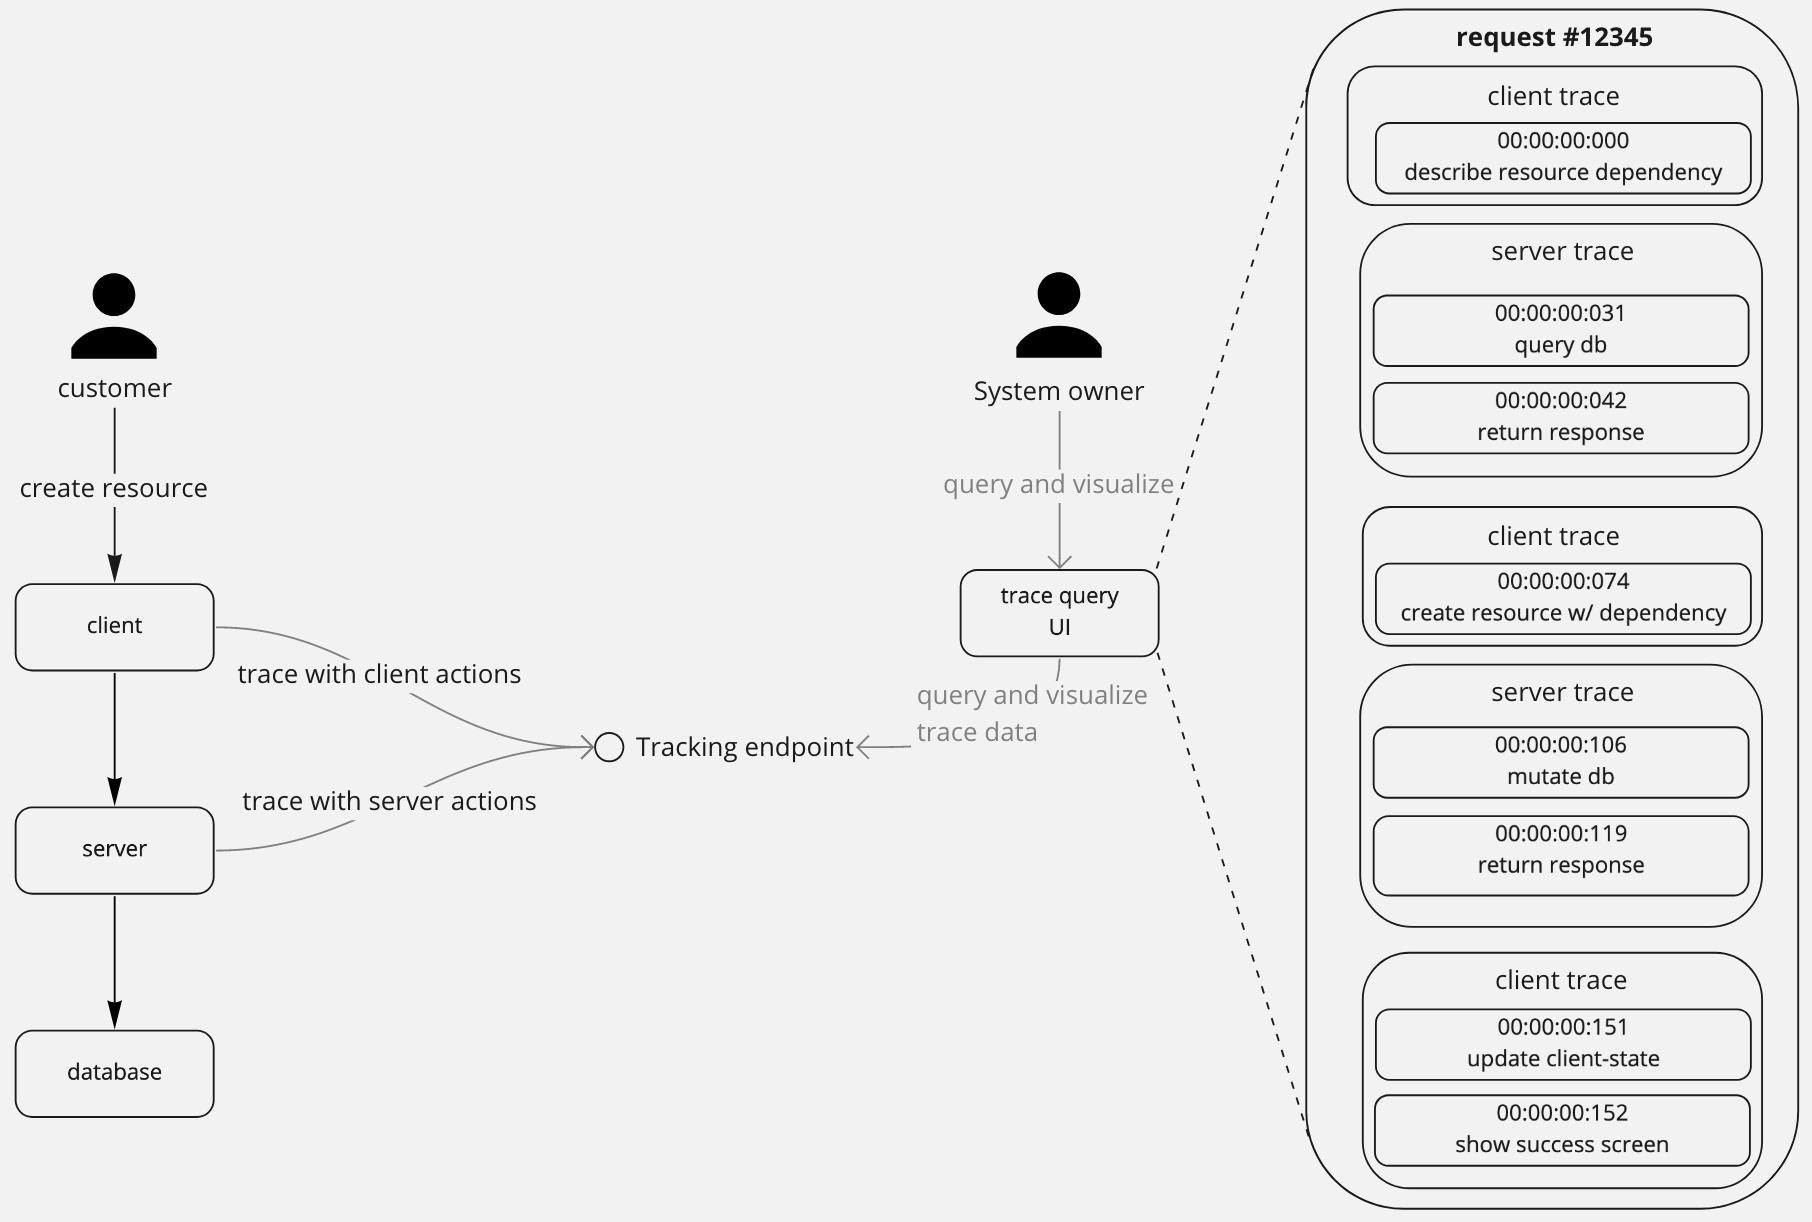
These are records of the individual actions taken by your systems when fulfilling a customer request. These help to track a request through multiple systems to determine where an issue occurred or to gain insight into your global system behaviour.
Event logs
What are the important events that were performed by my system recently?
These logs help you diagnose ongoing/recent issues or build insight into your system's behaviour. Retention of these logs needs to be long enough to help you diagnose events in the recent past (for me that's 3-6 months).
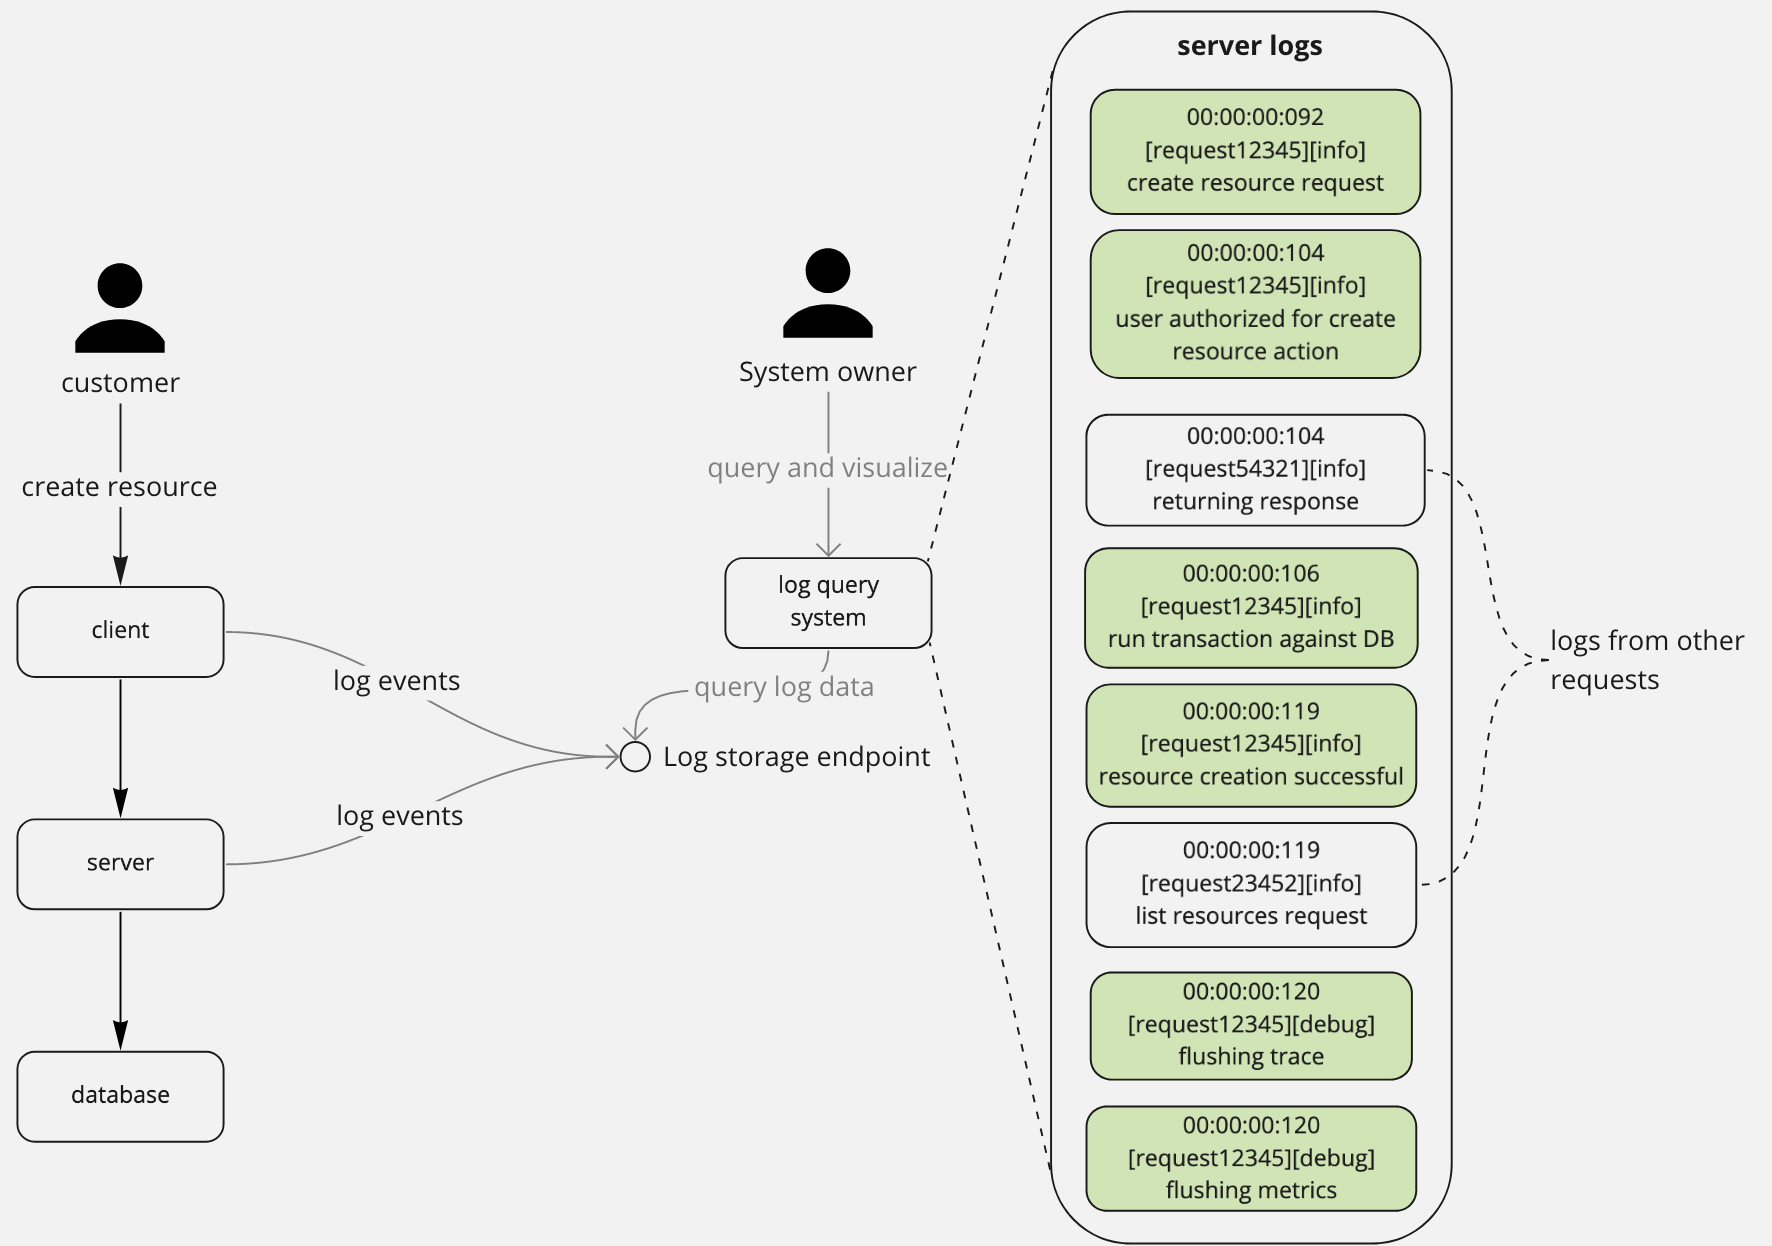
The logs in the stage above correspond to the 2nd server trace in the distributed traces section.
Audit logs
What are the events that customers/security/legal need to know about
These logs help you audit the work done by your system and can often be requested by customers or legal entities outside the company. Retention of these logs should be long enough to cover legal responsibilities e.g. on the scale of one or more years.
Understanding your customer experience
Customer traces
How did this customer use my system?
These are records of individual actions taken by a customer during a workflow. They help you build insight in how your product is being used and where customers are potentially losing interest/getting stuck/taking too long.
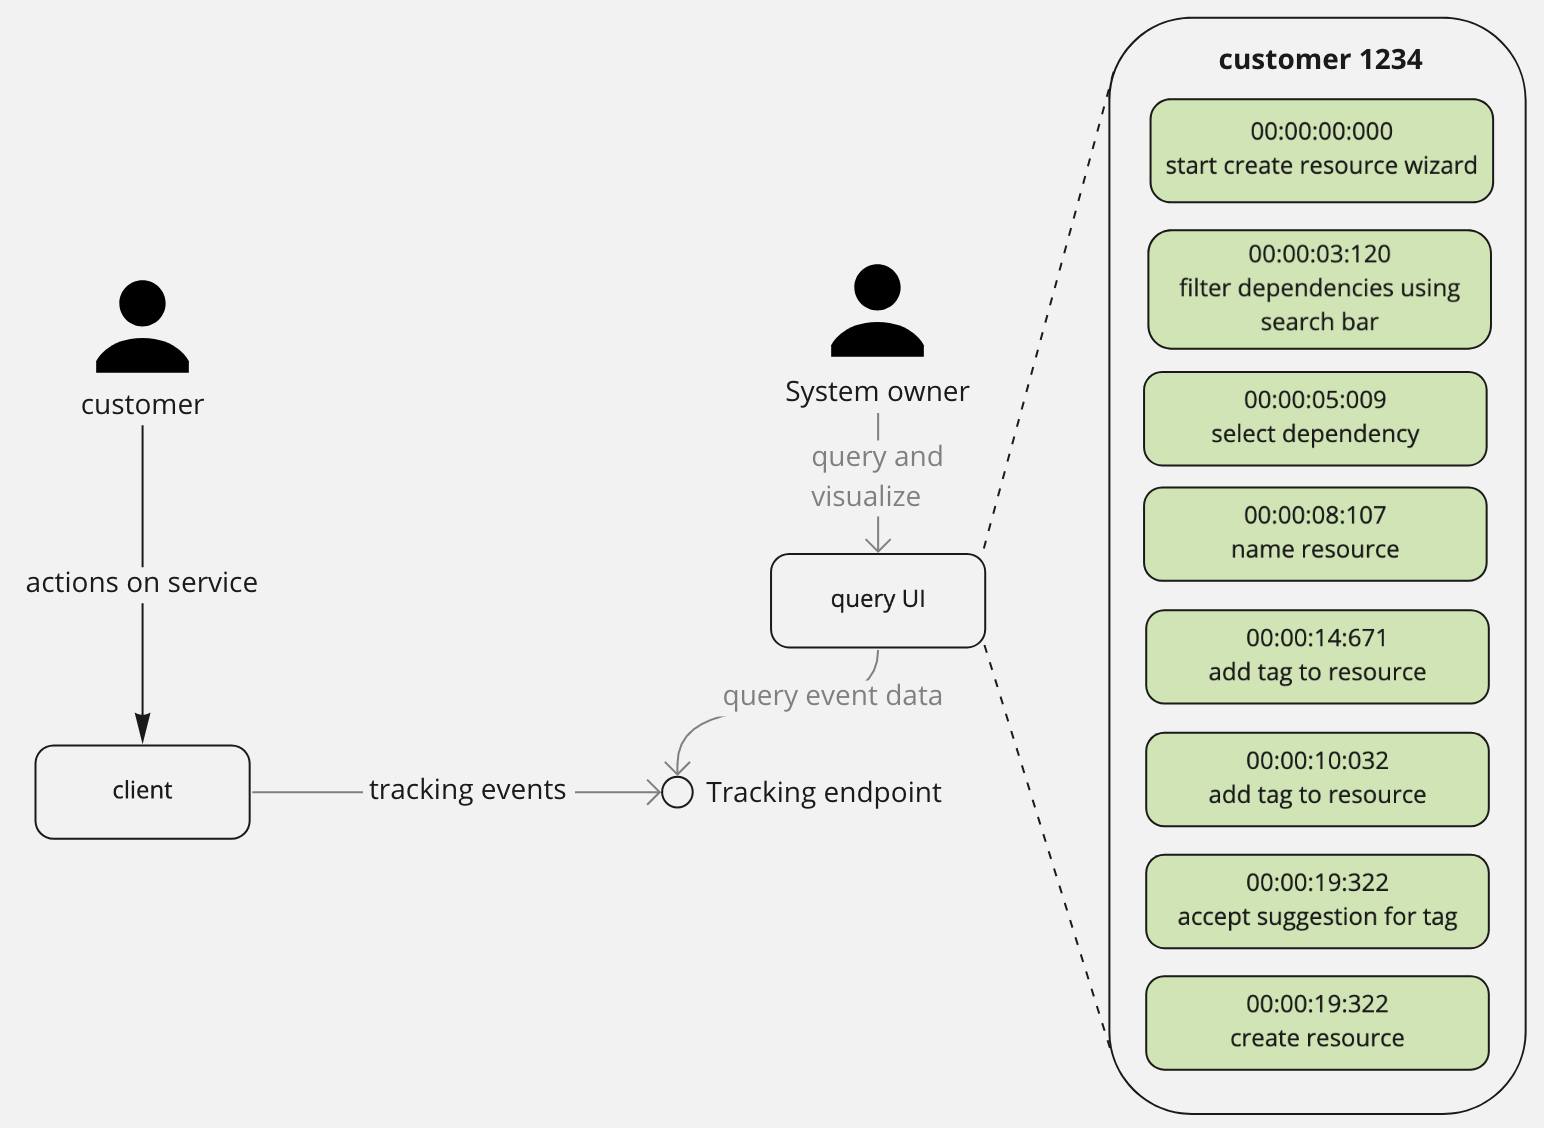
Example questions that traces can help answer:
- how many times did a customer open the help section while creating a resource?
- did a customer start using a resource immediately after creating it?
Customer analytics
What are the different customer personas using my system?
These are analytical investigations or workflows which aggregate and process many customer traces to gain insight across multiple customers. They help identify groups of usecases and customer personas to which you can tailor your experiences.
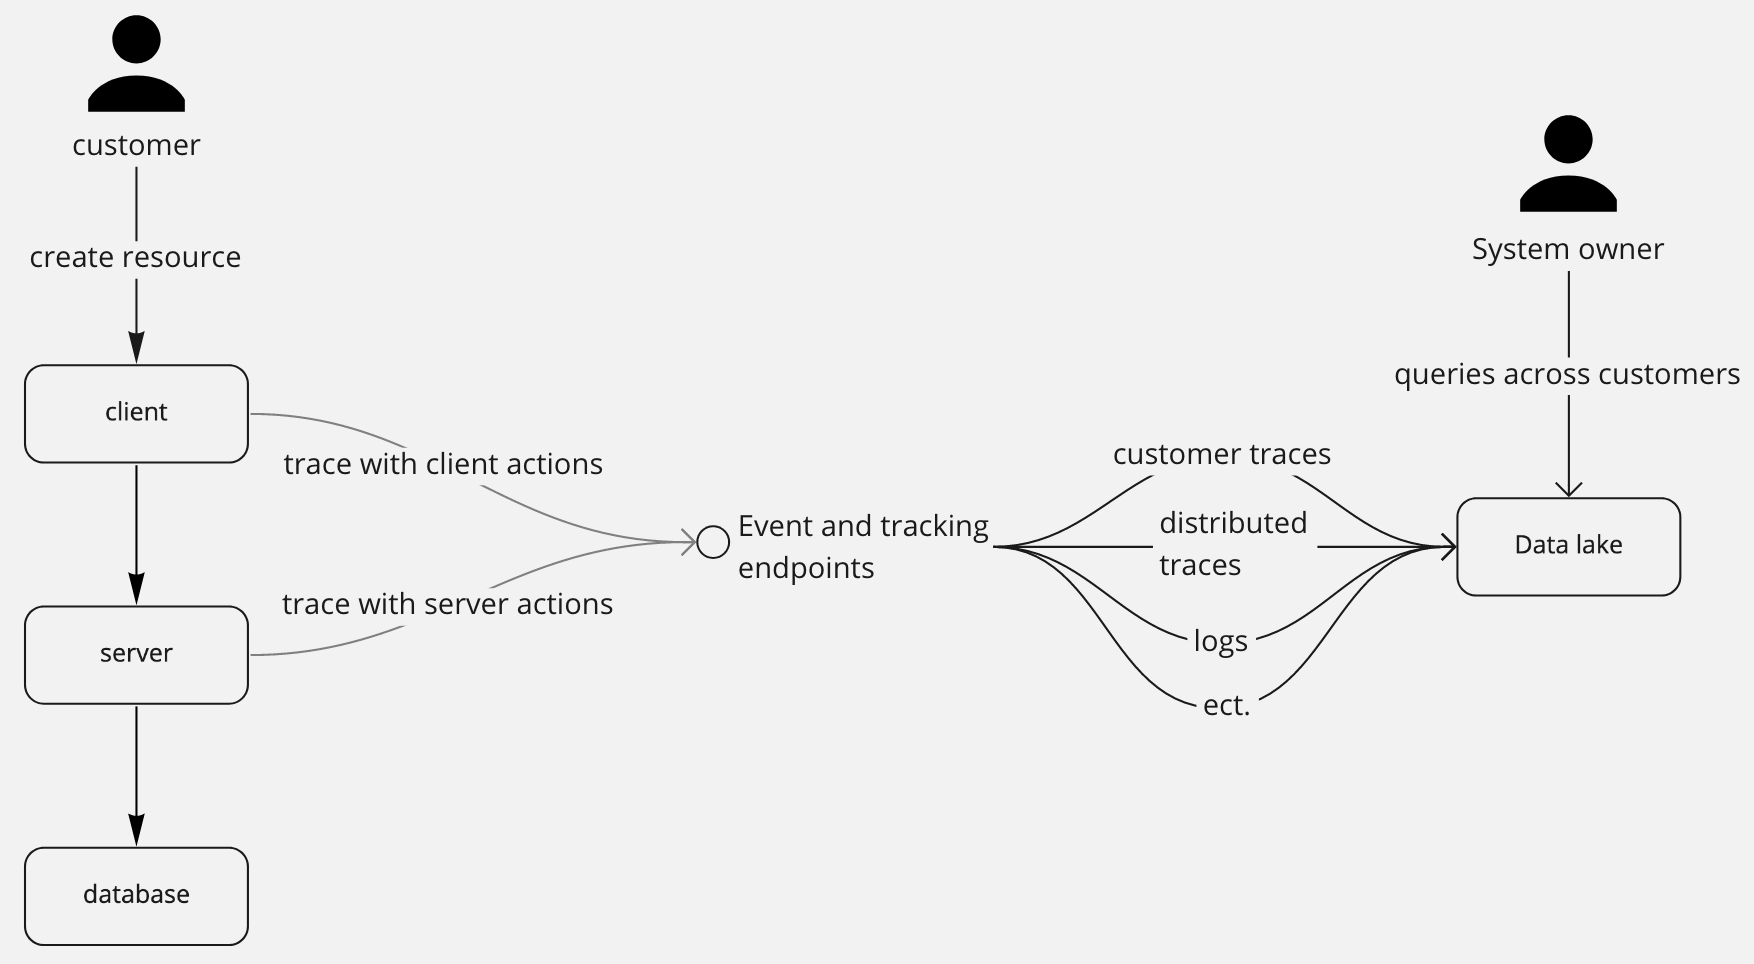
Examples results for analytical workflows:
- average resources of customers that make use of a feature
- probablity that a customer who uses "feature A" will also make use of "feature B"
- probablity that customers who have more than a certain number of resources will sign up for an enterprise account
- percentage of customers that fail to reach the 3rd step of a wizard
Resources
I found these personally very helpful:
- Amazon's approach to failing successfully - High-level overview for a strong operational posture .
- Instrumenting disributed systems for operational visibility - Low-level principles for implementing strong instrumentation in your systems.
- Building dashboards for operational visibility - A specific look at building dashboards across a system of microservices.